Last night I helped a close friend: I successfully fought off a Facebook account takeover. It wasn’t easy. I sweated for a couple of hours until I got it done. And I even had to face a rather unsophisticated, or maybe just lazy, enemy. Here I’ll recap what happened and give some easy but effective advice that you can easily use .
What happened?
As it happens with many IT professionals, I’m the go-to person for any computer related problems for family and friends.
My friend called me, frantically trying to explain that someone, using his Facebook account, was using Messenger to send personal messages to all his contacts. The message was in casual language, like you would talk to a friend, claiming that he had lost his wallet and asking if the friend has an account in a certain bank (obviously the bank had nothing to do with this). Most importantly, the message didn’t look obviously fake.

The response
Mitigation: informing people
To avoid people actually sending money, I logged into Messenger with my friend’s credentials and started sending messages to people that were replying, concerned about what had might have happened to their friend. I opted for something short, clear and alarming: “I’VE BEEN HACKED PLEASE IGNORE IT’S A VIRUS” (yes, I know that technically speaking that’s not especially accurate)
But the enemy was active and chatting with 2-3 of the contacts. In these cases, I saw my message being deleted.
I noticed that all his messages were more or less the same; he had some kind of playbook and was copy-pasting text, maybe slightly changing the text to fit the conversation.
And in one case he came close to being victorious: before I could sent the “please ignore” message, one of the contacts sent him some bank details -not sure what exactly as the message was deleted by the enemy, presumably after copying it. The contact then saw my message and replied alarmed “I sent him, what do I do now???” to which I replied “Call your bank NOW and lock your account and credit card”. I hope that helped; I’ll definitely follow up on that.
Taking back control of the account
The enemy hadn’t changed any password, so I was able to log in. Remember that Messenger accounts are controlled in Facebook (unless you have a Messenger-only account, which was not the case here). So the first thing I checked was the active sessions in Facebook (Settings > Security and Login Settings > Where You’re Logged In). That was what I got:

Unfortunately I didn’t know at the time that you can hover over the session with the mouse and get more info, like the session’s IP address. Had I done that, we could have a chance to retaliate -like going to the police.
My friend uses an Ubuntu laptop (which I set up for him), a Windows PC at work and a Samsung mobile where he uses Facebook and Messenger through the apps. So the first 3 sessions were almost certainly the enemy. I immediately disconnected him. Then I changed the password.
But we were not out of the woods yet.
The Empire Strikes Back
After changing the password and believing that I had locked him out for good, I continuing notifying people in Messenger. But after a few minutes, I suddenly saw a fresh batch of the same message being sent. My friend has around 500 contacts (“friends”) and I suppose there’s some limitation from Messenger so the enemy wasn’t able to send his message to everyone at once.
How was this possible? I had changed the password and disconnected his sessions. I glanced at Facebook Settings (“Where You’re Logged In”) and, sure enough, new sessions of the Huawei Mate 8 were there. He couldn’t have guessed the new 18-character completely random password I had set. I tried logging into Facebook from a private browser window and I got “Wrong password”. Hmmm… the options I had from Facebook for changing a forgotten password was 1) SMS 2) email 3) recognize people in pictures. Until that point, I had used SMS. So how did he do that?
I called my friend:
Me: please tell me that you don’t have the same password in your email as in Facebook
(note: his password was something like “oldman53#”)
Friend: no I don’t
Me: so what’s your email password?
Friend: The same but without the # at the end
NICE. Well that’s really damn secure I thought to myself, though I didn’t say anything -didn’t want to castigate my beleaguered friend, I’m saving that for the weekend 🙂
So first thing, as people were already replying in Messenger and there was real danger of someone sending money, I had to stop him getting in. So I went to Facebook settings to change the email.
The thing is, with the password already changed and unknown to me, I had to reset the password first. And Facebook wouldn’t send an SMS anymore, after having used it a few times already.
Return of the Jedi
So I had to resort to face recognition. The process presented me with 3 photos at a time, for a total of 5 people, and a list of possible names from the friends list. There was the option “I don’t know”, but you could use it only twice -then you were out.
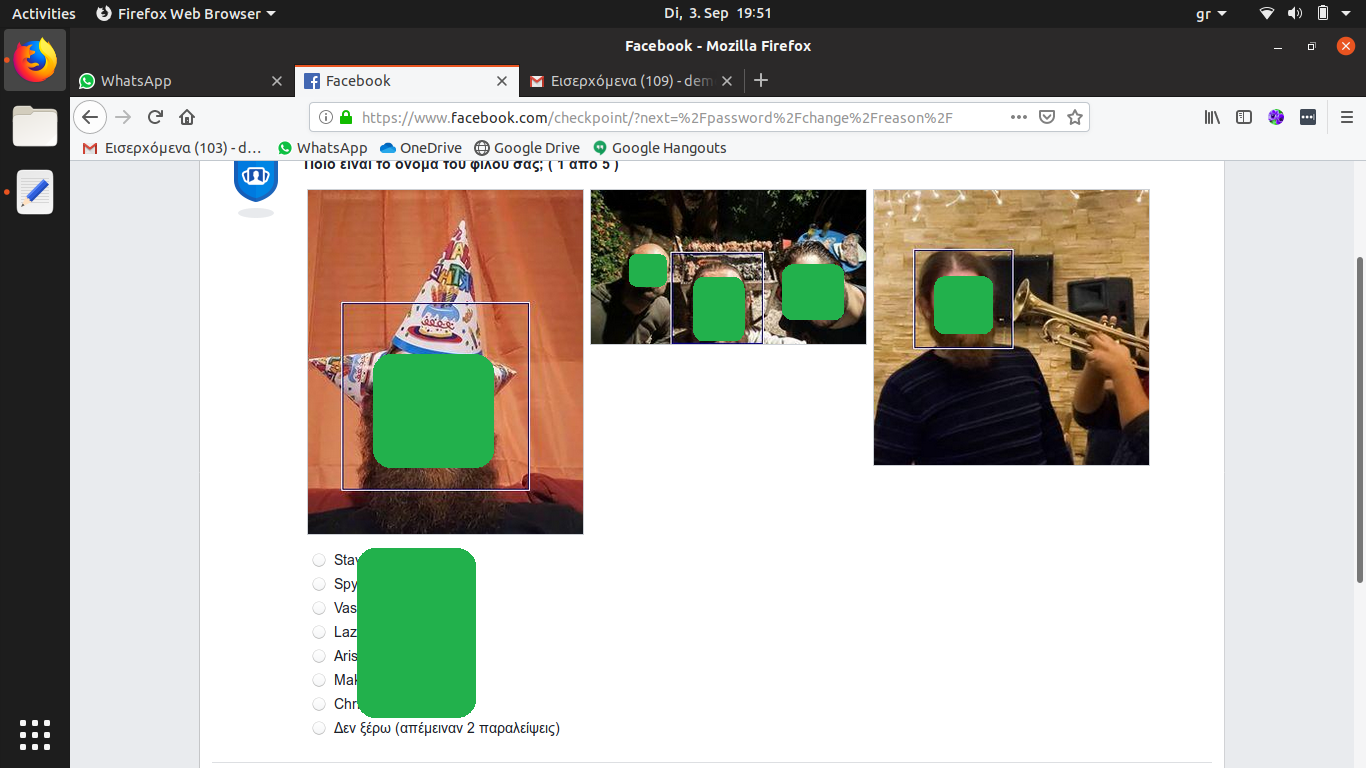
Obviously these people were unknown to me, so I had to send them through What’s App to my friend. It took us around 10 precious minutes but at the end it worked. I immediately changed the email to one that I own (and has a decent, unique password and multi-factor authentication!).
After that, I disconnected his sessions and that was the end of it, I didn’t see him again. I quickly headed over to outlook.com, where his email is hosted, changed the password there and added two factor authentication by SMS.
I anxiously kept monitoring Facebook’s sessions in case he somehow came back on one window and at the same time continued to notify the hundreds of people he had sent his message to. At the same time I tested, with a private browser window, that I even knowing the password I couldn’t login to Facebook or outlook.com without an SMS to my friend’s phone.
After around half an hour had passed, I felt the worst were behind us. I called my friend and told him to log in to Messenger and continue talking to people.
Some conclusions
To be clear, the reason this happened was because my friend, like many, many people, had bad password hygiene. He was using relatively easy (for a machine) to guess passwords but most importantly, he was reusing passwords between web sites. And web sites get passwords stolen. A lot.
What can you do to avoid this happening to you? Start from the low-hanging fruit. You get very decent security with very little effort.
So here’s a small TODO list:
UPDATE: I wrote a blog post explaining how to install and use a password manager. You can read it here.
- Use random long (18 character or more) passwords. If it’s really random (e.g zGasd6t7a6tgQaERys6Ld5AoVF567) you don’t even need symbols. Don’t create them by hand, use a password generator (like this).
- Use unique passwords. Every site or service you use needs to have its own. It will get stolen, eventually, but the damage will be contained to this site only. And no, oldman53 and oldman53# are NOT really different.
- The two points above are basically impossible for a human to do. So you need to use a password manager.
I use LastPass and I’m very happy with it. It costs around EUR 35 a year. If you want a free alternative use either Bitwarden or Firefox Lockwise.UPDATE: I’ve moved to Bitwarden Premium (just $10/year) and I’ve never been happier. I also recommend Bitwarden Free (+ Authy for 2FA) for my friends that don’t want to pay a cent. - When available, use two-factor authentication (2FA); you might also see it named as multi-factor authentication (MFA) or two-step validation (2SV, that’s what Amazon calls it). This is an absolute must. 2FA is when, in order to login to a service, you need a username, a password plus something more. Usually it’s an SMS, and that’s fine, but even better you can use an authenticator app. LastPass has its own, and its backed up in your LastPass account, but if you want a free alternative get either Authy or the one from Microsoft which is backed up in your Microsoft account. Obviously your authenticator backup needs to be well protected, so use two-factor for this as well -but a different one in case you lose access to it, so here SMS is better. UPDATE: Bitwarden Premium (not Free) can store 2FA in the same record where you store the site’s username & password. What’s really really really convenient with this is that, as soon as it fills in the password, it auto-copies the 2FA token to the clipboard, saving you the hassle. It doesn’t sound much but if you login to many different sites every day (as I do), you’ll love it.
How much effort is this?
I did this with my friend so I got a taste. Note that I’m in Switzerland and he’s in Greece, so he did the whole process with me giving instructions on the phone -which slowed us down considerably. But on the other hand I knew what had to be done, while less experienced users might be not so comfortable when doing this for the first time. We used Bitwarden + Authy.
- It took us around 90 min to set up Bitwarden and Authy, and then add all his passwords there. We set it up on his laptop and two mobile phones.
- It took another hour to change the password for the most important services (Gmail, Outlook.com, Paypal and Facebook) and to set up two-factor authentication.
- Add to that another 45 minutes of training, for him to learn to use a password generator, the password manager and 2FA. Basically how to use really long and random passwords when signing up to web sites, how to save the passwords in Bitwarden, how to log in from the laptop or phone without having to type the password and how to add 2FA (where available) in Authy.
So that was, what, almost three and a half hours in total. It’s not trivial. But trust me, if you find yourself in his shoes you’ll wish you had done it already. It’s time well spent 🙂