Software engineer from Crete living in Switzerland; C# & Azure paladin; economics hobbyist; firearm enthusiast; perpetually tormented by 3 beautiful women :-)
When your SQL Server DB log files are growing and your disk is close to being full (or, as it happened this morning, fill up completely thus preventing any DB operation whatsoever, bringing the affected system down!) you need to shrink them.
What this means, basically, is that you create a backup (do NOT skip that!) and then you delete information that allows you to recover the database to any point in time before the backup. That’s what SET RECOVERY SIMPLE & DBCC SHRINKFILE do. And since you kept a backup, you no longer need this information. You don’t need it for operations after the backup though, that’s why we go back to full recovery mode with SET RECOVERY FULL at the end.
So what you need is to login to your SQL Server with admin rights and:
USE DatabaseName
GO
BACKUP DATABASE DatabaseName
TO DISK = 'C:\dbbackup\DatabaseName.bak'
   WITH FORMAT,
      MEDIANAME = 'DatabaseNameBackups',
      NAME = 'Full Backup of DatabaseName';
GO
ALTER DATABASE DatabaseName SET RECOVERY SIMPLE;
GO
CHECKPOINT;
GO
DBCC SHRINKFILE ('DatabaseName_Log', 10);
GO
ALTER DATABASE DatabaseName SET RECOVERY FULL;
GO
Notice the 10 there -that’s the size, in MB, that the DB Log file will shrink to. You probably need to change that to match your DB needs. Also, the DatabaseName_Log is the logical name of your DB Log. You can find it in the DB properties. You probably also need to change the backup path from the example C:\dbbackup\DatabaseName.bak.
I’m not a fan of IT hubris. I cringe -literally- when I hear stuff like “let’s fight cancer (or whatever) with scrum”. You don’t fight diseases with IT; at best, you can help.
But help can be important. One problem that IT is very well suited to solve is understanding how viruses and bacteria behave under certain circumstances. The Folding@Home project explains:
WHAT IS PROTEIN FOLDING AND HOW IS IT RELATED TO DISEASE? Proteins are necklaces of amino acids, long chain molecules. They are the basis of how biology gets things done. As enzymes, they are the driving force behind all of the biochemical reactions that make biology work. As structural elements, they are the main constituent of our bones, muscles, hair, skin and blood vessels. As antibodies, they recognize invading elements and allow the immune system to get rid of the unwanted invaders. For these reasons, scientists have sequenced the human genome – the blueprint for all of the proteins in biology – but how can we understand what these proteins do and how they work?
However, only knowing this sequence tells us little about what the protein does and how it does it. In order to carry out their function (e.g. as enzymes or antibodies), they must take on a particular shape, also known as a “fold.” Thus, proteins are truly amazing machines: before they do their work, they assemble themselves! This self-assembly is called “folding.”
WHAT HAPPENS IF PROTEINS DON’T FOLD CORRECTLY? Diseases such as Alzheimer’s disease, Huntington’s disease, cystic fibrosis, BSE (Mad Cow disease), an inherited form of emphysema, and even many cancers are believed to result from protein misfolding. When proteins misfold, they can clump together (“aggregate”). These clumps can often gather in the brain, where they are believed to cause the symptoms of Mad Cow or Alzheimer’s disease.
The project has made it very easy for anyone to help. You just download and install their software, and your computer starts calculating, solving math problems -essentially, you’re giving your computer’s processing power when you don’t use it. You can see your -and other’s- contribution in the project stats.
I heartily encourage you to do so.
That’s my HP i7, sitting in the attic and doing what little it can to help beat COVID19.
I’ve written before an example on how to use Powershell and FetchXml to get records from a Dynamics CRM instance. But there’s a limit, by default 5000 records, on how many records CRM returns in a single batch -and for good reason. There are many blog posts out there on how to increase the limit or even turn it off completely but this is missing the point: you really really really don’t want tens or hundreds of thousand -or, god forbid, millions- of records being returned in a single operation. That would probably fail for a number of reasons, not to mention it would slow the whole system to a crawl for a very long time!
So we really should do it the right way, which is to use paging. It’s not even hard! It’s basically almost the same thing, you just need to add a loop.
That’s the code I wrote to update all active records (the filter is in the FetchXml, so you can just create yours and the code doesn’t change). I added a progress indicator so that I get a sense of performance.
#
# Source: DotJim blog (http://dandraka.com)
# Jim Andrakakis, June 2020
#
# Prerequisites:
# 1. Install PS modules
#    Run the following in a powershell with admin permissions:
#       Install-Module -Name Microsoft.Xrm.Tooling.CrmConnector.PowerShell
#       Install-Module -Name Microsoft.Xrm.Data.PowerShell -AllowClobber
#
# 2. Write password file
#    Run the following and enter your user's password when prompted:
#      Read-Host -assecurestring | convertfrom-securestring | out-file C:\usr\crm\crmcred.pwd
#
# ============ Constants to change ============
$pwdFile = "C:\usr\crm\crmcred.pwd"
$username = "myuser@mycompany.com"
$serverurl = "https://myinstance.crm4.dynamics.com"
$fetchxml = "C:\usr\crm\all_active.xml"
# =============================================

Clear-Host
$ErrorActionPreference = "Stop"

# ============ Login to MS CRM ============
$password = get-content $pwdFile | convertto-securestring
$cred = new-object -typename System.Management.Automation.PSCredential -argumentlist $username,$password
try
{
    $connection = Connect-CRMOnline -Credential $cred -ServerUrl $serverurl
}
catch
{
    Write-Host $_.Exception.Message
    exit
}
if($connection.IsReady -ne $True)
{
    $errorDescr = $connection.LastCrmError
    Write-Host "Connection not established: $errorDescr"
    exit
}
else
{
    Write-Host "Connection to $($connection.ConnectedOrgFriendlyName) successful"
}

# ============ Fetch data ============
[string]$fetchXmlStr = Get-Content -Path $fetchxml

$list = New-Object System.Collections.ArrayList
# Be careful, NOT zero!
$pageNumber = 1
$pageCookie = ''
$nextPage = $true

$StartDate1=Get-Date

while($nextPage)
{
    if ($pageNumber -eq 1) {
        $result = Get-CrmRecordsByFetch -conn $connection -Fetch $fetchXmlStr
    }
    else {
        $result = Get-CrmRecordsByFetch -conn $connection -Fetch $fetchXmlStr -PageNumber $pageNumber -PageCookie $pageCookie
    }

    $EndDate1=Get-Date
    $ts1 = New-TimeSpan –Start $StartDate1 –End $EndDate1

    $list.AddRange($result.CrmRecords)

    Write-Host "Fetched $($list.Count) records in $($ts1.TotalSeconds) sec"

    $pageNumber = $pageNumber + 1
    $pageCookie = $result.PagingCookie
    $nextPage = $result.NextPage
}


# ============ Update records ============
$StartDate2=Get-Date

$i = 0
foreach($rec in $list) {
    $crmId = $rec.accountid
    $entity = New-Object Microsoft.Xrm.Sdk.Entity("account")
    $entity.Id = [Guid]::Parse($crmId)
    $entity.Attributes["somestringfieldname"] = "somevalue"
    $entity.Attributes["somedatefieldname"] = [datetime]([DateTime]::Now.ToString("u"))
    $connection.Update($entity)
    $i = $i+1
    # this shows progress and time every 1000 records
    if (($i % 1000) -eq 0) {
        $EndDate2=Get-Date
        $ts2 = New-TimeSpan –Start $StartDate2 –End $EndDate2
        Write-Host "Updating $i / $($list.Count) in $($ts2.TotalSeconds) sec"
    }
}

$EndDate2=Get-Date
$ts2 = New-TimeSpan –Start $StartDate2 –End $EndDate2

Write-Host "Updated $($list.Count) records in $($ts2.TotalSeconds) sec"
For my purposes I used the following FetchXml. You can customize it or use CRM’s advanced filter to create yours:
Something to keep in mind here is to minimize the amount of data being queried from CRM’s database and then downloaded. Since we’re talking about a lot of records, it’s wise to check your FetchXml and eliminate all fields that are not needed.
Some time ago, a friend of mine (the one of “How I fought off a Facebook hacker” fame) had problems with his Windows laptop, basically the machine became next to useless. Sadly, while I generally like Windows (there are exceptions) this is something that happens all too often. So I solved it by installing Ubuntu, and even though he’s not technically proficient he’s very happy -the machine isn’t exactly lightning fast, but it works and it’s stable.
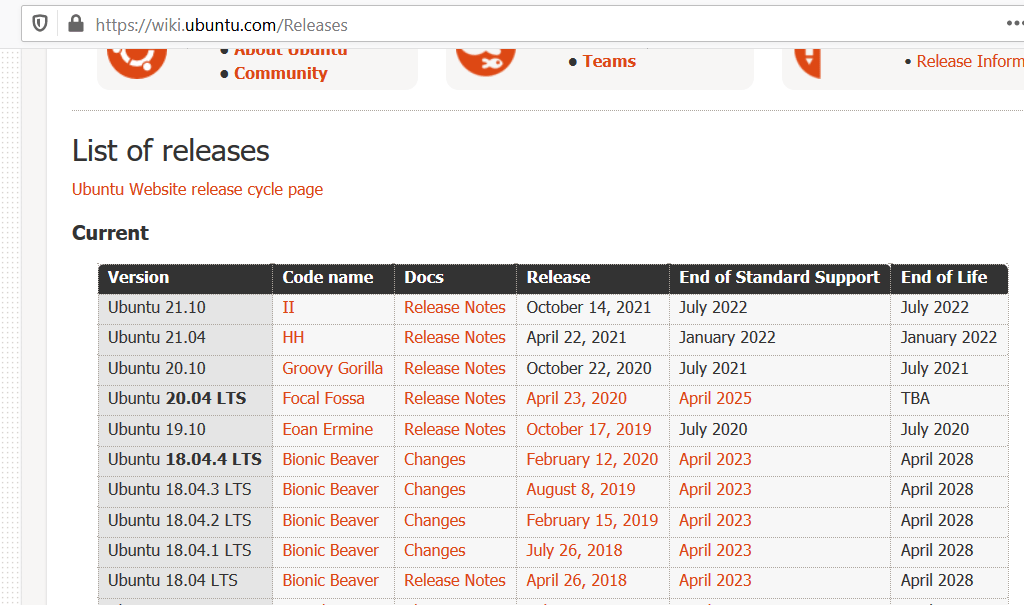
But a small mistake I made was installing the latest-greatest Ubuntu version available at the time, 19.04. Now for those who don’t know, Ubuntu has some releases that are supported for a long time, called LTS for Long Term Support, and the ones in between that are… not. Full list here.
So as of January 2020, 19.04 went into End-Of-Life status, meaning you can’t download and install updates the normal way (apt upgrade) any more. And without updates, you can’t upgrade to a newer release (do-release-upgrade) as well. The first symptom is that, while trying to install updates, he was getting errors similar to the following:
E: Unable to locate package XXX
An additional problem is that we’re in different countries, so I couldn’t just do the usual routine backup-format-reinstall everything 🙂
But as usual, Google is your friend! That’s how I solved it from the command line:
sudo sed -i -re 's/([a-z]{2}\.)?archive.ubuntu.com|security.ubuntu.com/old-releases.ubuntu.com/g' /etc/apt/sources.list
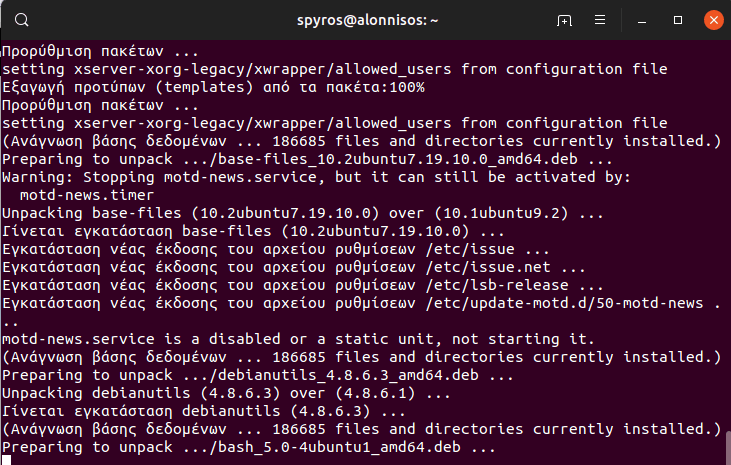
sudo apt update
sudo apt upgrade
# ...wait for like 30min, then restart...
sudo do-release-upgrade
# ...wait for a couple of hours, restart
What does this do? Well everything except the first line is the standard procedure to upgrade: update (i.e. refresh info for) the software repositories, upgrade (i.e. download and install the updates), restart and then do-release-upgrade which upgrades the complete Ubuntu system -always to the latest LTS release.
But the “magic” is in the first line (and let’s give credit where it’s due). This changes the list that keeps the repositories location (/etc/apt/sources.list) from the normal locations (under archive.ubuntu.com or security.ubuntu.com) to the “historic” servers, old-releases.ubuntu.com. For more info, see “Update sources.list” here.
So after that is done, apt upgrade can now install whatever updates are available and then do-release-upgrade can do its job.
When working with XML files, which I usually process with Powershell scripts, sometimes I stumble on the following error message:
Select-Xml : The file 'C:\data\lalala.xml' cannot be read: The input document has exceeded a limit set by MaxCharactersInDocument.
The problem here is that Powershell has a hard-coded limit to stop you from reading huge files. This limit is 536870912 bytes (0.5 Gb).
So what can you do if you need to process such a large file? C# to the rescue! You can add inline C# code that uses XmlTextReader, which is very fast.
The specific problem I had to solve is to get all the IDs from several XML files and create SQL out of them. Then I used this SQL to create a temp table in my SQL server, like this:
SELECT t.* INTO #documentids FROM (
  SELECT 'e29e16f9-f77e-4dce-92e0-99fef71c868d' AS id UNION ALL
  SELECT '0cd0fef5-0037-492e-861f-593f7322c2a3' AS id UNION ALL
  SELECT 'e963a4da-2a60-43f1-b4d4-9b07b9d07d57' AS id UNION ALL
  -- <all the stuff created by powershell>
  SELECT 'ca70d7b7-40c8-418d-8612-42fe2fd5bf28' AS id
) t
But of course you can easily customize the code to meet your needs.
I tested with an 1.76 Gb XML on my dev laptop. It took 19.6 seconds. Not bad 🙂
Here’s the code I used:
#
# Source: DotJim blog (http://dandraka.com)
# Jim Andrakakis, January 2020
#
Clear-Host
$ErrorActionPreference='Stop'

$referencingassemblies = ("System.XML.dll")
Add-Type -ReferencedAssemblies $referencingassemblies -Language CSharp @"
using System;
using System.IO;
using System.Xml;
using System.Collections.Generic;
namespace DotJim.Powershell
{
    public static class Xml
    {
        public static List<string> GetAttributes(string fileName, string localName, string template)
        {
            var list = new List<string>();
            XmlTextReader txtreaderObj = new XmlTextReader(fileName);
            txtreaderObj.WhitespaceHandling = WhitespaceHandling.None;
            while (txtreaderObj.Read())
            {
                if (txtreaderObj.LocalName.Equals(localName) &&
                txtreaderObj.IsStartElement())
                {
                     txtreaderObj.Read();
                     //Console.WriteLine(txtreaderObj.Value);
                     string s = txtreaderObj.Value;
                     string line = string.Format(template, s);
                     list.Add(line);
                }
            }
            return list;
        }
    }
}
"@;

# Here I'm trying to create a big SELECT sql statement out of all the IDs in the xml
$template = "SELECT '{0}' AS id UNION ALL"
$fileList = @("C:\data\printdata1.xml", "C:\data\printdata1.xml")

$StartDate=(Get-Date)

foreach($fileName in $fileList)
{
    $list = [DotJim.Powershell.Xml]::GetAttributes($fileName, "DocumentId", $template)
    $list[$list.Count-1] = $list[$list.Count-1].Replace("UNION ALL", "")
    Out-File -FilePath $fileName.Replace(".xml", ".sql") -InputObject $list
}

$EndDate=(Get-Date)

$timeDiff = New-TimeSpan –Start $StartDate –End $EndDate
Write-Host "Finished processing $($fileList.Count) files in $($timeDiff.TotalSeconds) seconds"
You wake up on a beautiful sunny Swiss Sunday morning.
You go in front of your filter coffee machine which, spoiler, you have programmed to brew a coffee on a fixed time every day except Sunday.
You wait, like, 5 minutes in front of it wondering why there’s no coffee in the pot and pondering conspiracy theories which you will not confirm nor deny to include coffee-snatching aliens from Tau Ceti.
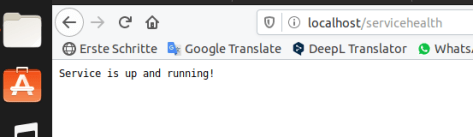
We already saw that the health page works. But it’s time to check if our objective was met.
Remember, the goal is to let developers outside our network use the mock service to help them with their implementation. To see if this works as intended, we can use the swagger file we created and the online Swagger editor.
So open the CustomerTrust.yaml file with a text editor, copy all its contents, navigate your browser to https://editor.swagger.io, delete the default content and paste ours. You’ll get this:
Select the mock service from the drop down, click on one of the services, click “Try it out” and then “Execute“. After a few seconds you… will get an error, something like “NetworkError when attempting to fetch resource.“
Why? Well it’s the browser preventing us from doing do. If you press F12 and watch the Console, you’ll see something like “Cross-Origin Request Blocked: The Same Origin Policy disallows reading the remote resource at xxxxxx”. More info here, but in short, it’s a security measure. You can either disable it in your browser’s settings (WHICH IS A BAD IDEA) or use the curl utility, which you can download here for your operating system.
[EDIT] or I could not be lazy, go back to the wiremock config and set the CORS-related HTTP response headers properly, as explained here, here and specifically for wiremock here.
So after you install curl, you can get the command line from the Swagger Editor:
For GET, the command should be:
curl -X GET "https://graubfinancemock.azurewebsites.net/api/1.0/CustomerTrust/CHE-123.456.789" -H "accept: application/json"
Which ever method you pick -GET or POST- we’ll add to this a -v at the end (for more info). So run it and at the end you’ll get this:
401 Unauthorized* Connection #0 to host graubfinancemock.azurewebsites.net left intact
Makes sense right? The mock service expects an authorization token which we haven’t provided. Let’s add this:
A small note on Windows: if you try this in Powershell, it seems that the json escaping is acting funny. If you try it through cmd, it works just fine.
That’s all folks
So now our kind-of-fictional-but-actually-quite-real developers can access the service and test their code against it. And wherever we make a change and push it, the service is updated automatically. Not bad, isn’t it? 🙂
That concludes this guide and its introductory journey in the world of Devops (or, as a friend of mine more accurately calls the field, SRE -short for “Site Reliability Engineering”).
I hope you enjoyed it as much as I did writing it -I really did. I’m sure you’ll have many, many questions which I can try to answer -but no promises 🙂 You can ask here in the comments (better) or in my twitter profile @JimAndrakakis.
Resources
I’ve put all the code in a github repository, here; the only change is that I moved the pipeline yaml in the devops folder and removed my name. You can also find the docker image in docker hub, here.
Put a little magic in your life: create the auto-deploy pipeline
We’re close to the end of our journey.
So far we’ve basically done everything we need. In this last step we’ll also make it happen automagically: we want to be able to do changes to our code (which, in our scenario, is the wiremock service configuration) and have them get deployed on Azure without us having to do anything.
We’ll use Azure Devops -formerly called Visual Studio Team System (VSTS) or, even earlier, Team Foundation Server (TFS) Online- for this. There are other services we could use as well, like Github or Bitbucket, and they’re equally good.
But whatever your service, in general this process is called CI/CD, short for Continuous Integration / Continuous Delivery. Simply put, CI means that your code is built and tested as soon as you push changes in source control. if the build or any test is not successful, the code changes are rolled back, guaranteeing (well, as far as your tests are concerned) that the code in the repo is correct. CD is the next step, taking the build and deploying it, usually in a test server, then in a staging one and then to production.
So as a first step, create a free account in Azure Devops. You can use the same Microsoft account you used in Azure or different. Once you’ve logged in, create a new project. Let’s call it GraubFinanceMockService.
By default we got a Git repository with the same name as the project. Let’s clone it in our development PC (i’m using C:\src\test, but feel free to use whatever you like).
Make sure you have git installed (or download it from here), then open a command prompt and type (replace the URL with your details):
cd c:\src\test
git clone https://dev.azure.com/YOURUSERNAME/GraubFinanceMockService/_git/GraubFinanceMockService
You’ll be asked for credentials of course (you might want to cache them). After that you’ll get a folder named GraubFinanceMockService. Move in there the folders we created during our previous steps: openapi, wiremock and devops.
Additionally, to avoid committing unwanted files in the repository, create an empty text file on the top folder named .gitignore, open it with a text editor and paste the following:
Now we’ll start setting up our build. “But wait”, you might reasonably ask, “we don’t really have any code to build, that’s no C# or Java or whatever project, why do we need a build?”.
Well, we do need to build our docker image, and push it in Docker Hub. This way when we change anything in our wiremock config, we’ll get a new image to reflect that.
But before we continue, remember that we have some variables in our tfvars files that we need to replace? Now it’s time to do that. Under Pipelines go to Library, then (+) Variable Group. Name the variable group azureconnectioncredentials, then add four variables (click the lock to set them as secret!):
subscription_id tenant_id client_id client_secret
Be sure to check that “Allow access from all pipelines” is enabled.
But how do you get these values? From Azure CLI. The process is described by Microsoft here, but in short, open a command prompt (remember that from the previous step, we are logged in with Azure CLI already) and write:
az account show
# note the id, that's the subscription id, and the tenant id
az ad sp create-for-rbac --role="Contributor" --scopes="/subscriptions/SUBSCRIPTIONID"
You’ll get something like the following, which you need to keep secret (the recommended way is to use a password manager):
So paste these values to the respective variables in Azure Devops. You got the subscription id and tenant id from the first command (az account show). From the second (az ad sp create-for-rbac) get the appId and put it in the client_id variable, and get the password and put it in the client_secret variable. At the end, click Save.
You did set the variables to secret right? 🙂
We need one more variable group for the not-secret stuff. Create a new variable group, name it azurenames and add the following variables (here with sample values):
Also here we need “Allow access from all pipelines” to be enabled.
Now we’re ready to create a new pipeline. In Azure Devops go to Pipelines > Builds > New Pipeline. You can click “Use the classic editor” if you’re not comfortable with YAML, but here I’ll use Azure Repos Git (YAML) as I can copy paste the result here. Select your code repository and then, to see how it works step by step, Starter Pipeline.
Our new build will get the sources in a directory on the build server, but nothing more than that. Let’s start telling the build server what to do.
First, we need to tell it to use our variable groups. Delete whatever default code is there and paste the following:
Now click on Show Assistant on the right, search for Docker and pick Docker (description: Build or push Docker images etc etc). Connect your container registry as follows:
In Container repository you enter the full name of the docker hub repository (YOURUSERNAME/graubfinancemock in our example) but even better, we can use our variable (same for the desired version). So enter $(dockerimage), then change to tags to:
$(dockerimageversion) 1.0.$(Build.BuildId)
Leave everything else to default values, click Add. Under steps you should have the following:
Having built our service, let’s deploy it. Paste the following at the end of the YAML file:
  - job: Deploy
    displayName: Deploy to Azure
    steps:
Now we need to run our cleanup script, then replace the variables in the tfvars files, then run terraform. Search for task Azure CLI, then configure the Azure subscription. Script type is Powershell Core, script location is Script Path, script path is $(Build.SourcesDirectory)/devops/cleanup.ps1 and script arguments is “-rgName ‘$(baseName)’” (without the double quotes, but note the single quotes). But remember, this is not on the root of our code repository. Click on Advanced and in working directory enter “$(Build.SourcesDirectory)/devops“(without the double quotes). You should end up with the following:
Time to replace the variable values. Add another task named Replace Tokens. Change the target files to **/*.tfvars, uncheck the BOM (it creates problems somtimes). Done.
Next up, terraform. We have the batch file ready, but we need terraform.exe to be available. So add a task named Terraform tool installer. Change the version to the latest (find it here, at the time of writing it’s 0.12.15).
Everything’s ready to run our batch script. As we need Azure CLI to be available for terraform to work the way we want to, add another Azure CLI task . Pick the Azure subscription from the drop down (you don’t have to configure it again). Script type is Powershell Core, script location is Script Path, script path is $(Build.SourcesDirectory)/devops/terraformdeploy-pipeline.ps1 (it’s the one that uses the replaced .tfvars file). Click on Advanced and in working directory enter “$(Build.SourcesDirectory)/devops“(without the double quotes). At the end it should look like this:
Infrastructure as Code: time to ship these containers
So we built our mock service and we dockerized it. Next up, run the container on the cloud.
Remember that in our scenario -and in my everyday work life- the mock service has to be accessible from people outside our local network. Of course, one way to do this would be to run it in-house and open a hole in your firewall.
…if you didn’t scream “BAD IDEA!” when you read the last sentence, now it would be the right time to do so 🙂
So, cloud to the rescue. We’ll use Azure here; we’ll create a subscription and then deploy with a terraform infrastructure-as-service (IaC) configuration. So our steps will be:
Test that it works by calling the /servicehealth path of the mock service.
If you’re deploying an actual application (say, a REST API that connects to a database) on the cloud you probably need more. For example, you might need a firewall, a virtual LAN so that different servers talk to each other but are isolated from the world, an API gateway, a cloud sql database and maybe more. But for our mock service, which has no data that need protection, we can keep it really simple.
Open the azure portal and either create a new subscription or login if you have one already. For new subscriptions, Microsoft gives $200 or usage for free so you can experiment a bit. Running this tutorial has taken me less than $1 out of this amount, so no money actually left my pocket 🙂
After you created the subscription, you need to download the Azure Command-Line Interface (CLI), which is basically a powershell module. If you’re running on Linux -as I am at home- you also need Powershell Core (get it here). After installing, open a powershell prompt (you can also do it from ye olde command prompt) and run:
az login
Follow the instructions and you’re done.
2. Create an devops folder and create an empty text file inside. Name it service.tf and paste the following:
# Configure the Azure provider
provider "azurerm" {
  # for production deployments it's wise to fix the provider version
  #version = "~>1.32.0"

  subscription_id = var.subscription_id
  client_id       = var.client_id
  client_secret   = var.client_secret
  tenant_id       = var.tenant_id
}

# Create a new resource group
resource "azurerm_resource_group" "rg" {
    name     = var.basename
    location = var.azurelocation

    tags = {
        environment = var.envtype
    }
}

# Create an App Service Plan with Linux
resource "azurerm_app_service_plan" "appserviceplan" {
  name                = "${azurerm_resource_group.rg.name}-APPPLAN"
  location            = azurerm_resource_group.rg.location
  resource_group_name = azurerm_resource_group.rg.name

  # Define Linux as Host OS
  kind = "Linux"
  reserved = true # Mandatory for Linux plans

  # Choose size
  # https://azure.microsoft.com/en-us/pricing/details/app-service/linux/
  sku {
    tier = var.SKUtier
    size = var.SKUsize
  }
}

# Create an Azure Web App for Containers in that App Service Plan
resource "azurerm_app_service" "appsvc" {
  name                = azurerm_resource_group.rg.name
  location            = azurerm_resource_group.rg.location
  resource_group_name = azurerm_resource_group.rg.name
  app_service_plan_id = azurerm_app_service_plan.appserviceplan.id

  # Do not attach Storage by default
  app_settings = {
    WEBSITES_ENABLE_APP_SERVICE_STORAGE = false

    /*
    # Settings for private Container Registires
    DOCKER_REGISTRY_SERVER_URL      = ""
    DOCKER_REGISTRY_SERVER_USERNAME = ""
    DOCKER_REGISTRY_SERVER_PASSWORD = ""
    */
  }

  # Configure Docker Image to load on start
  site_config {
    linux_fx_version = "DOCKER|${var.DockerImage}"
    #always_on        = "false"
    #ftps_state       = "FtpsOnly"
  }

  logs {
    http_logs {
      file_system {
        retention_in_days = var.logdays
        retention_in_mb   = var.logsizemb
      }
    }
  }

  identity {
    type = "SystemAssigned"
  }
}

output "DockerUrl" {
    value = azurerm_app_service.appsvc.default_site_hostname
}
Inside this configuration you may have noticed that we used a few variables, like var.basename. In terraform, we define variables and their values in separate files so that we can use the same base configuration with different details. A common scenario is the same configuration for testing, staging and production environments but with different names (think graubfinance-test for testing, graubfinance-staging for preprod and graubfinance for prod), different service levels etc.
Following best practice, these variables should be defined. Create another empty file called service-vars.tf and paste the following:
variable "basename" {
  type    = string
}

variable "azurelocation" {
  type    = string
}

variable "subscription_id" {
  type    = string
}

variable "client_id" {
  type    = string
}

variable "client_secret" {
  type    = string
}

variable "tenant_id" {
  type    = string
}

variable "envtype" {
    type    = string
}

variable "SKUsize" {
    type    = string
}

variable "SKUtier" {
    type    = string
}

variable "DockerImage" {
    type    = string
}

variable "logdays" {
    type    = number
}

variable "logsizemb" {
    type    = number
}
Now we need one or more “variable values” (.tfvars) files to define the values for our intended environment. Create yet another file, name it service-varvalues-dev.tfvars and paste the following:
basename = "graubfinancemock"

# when logging in as a user via Azure CLI, these values must be null
subscription_id = null
client_id       = null
client_secret   = null
tenant_id       = null

envtype = "test"

# this can change depending on your preferences
# you can get location codes using
# az account list-locations
# e.g. try "eastus" or "centralindia"
azurelocation = "westeurope"

# Using the free tier generates an error.
# Seems that Microsoft does not want people to
# use their resources *completely* free?
# Who knew!
#SKUtier = "Free"
#SKUsize = "F1"

# This is still very cheap though
SKUtier = "Basic"
SKUsize = "B1"

DockerImage = "dandraka/graubfinancemock:latest"

logdays = 30
logsizemb = 30
We’ll use this when testing locally but for later (when we deploy via Azure Devops) we’ll need the same but with placeholders for the deployment process to change. So copy-paste this file as service-varvalues-pipeline.tfvars and change it to look like this:
basename = "#{basename}#"

# when logging in as a service, these must NOT be null
subscription_id = "#{subscription_id}#"
client_id       = "#{client_id}#"
client_secret   = "#{client_secret}#"
tenant_id       = "#{tenant_id}#"

envtype = "#{envtype}#"
azurelocation = "#{azurelocation}#"

SKUtier = "#{SKUtier}#"
SKUsize = "#{SKUsize}#"

DockerImage = "#{dockerimage}#"

logdays = 30
logsizemb = 30
Obviously the parts between #{…}# are placeholders. We’ll talk about these when we create the pipeline.
3. Now we’ll use terraform to deploy this configuration. Install terraform (instructions here, but basically it’s just an exe that you put in your path), then create a text file in your devops dir, name it terraformdeploy-dev.ps1 and paste the following:
terraform init
# here you need to see stuff happening and then
# "Terraform has been successfully initialized!"
terraform plan -out="out.plan" -var-file="service-varvalues-dev.tfvars"
# if everything went well, apply
terraform apply "out.plan"
Run it. If everything went well, you should get the following (or similar) output at the end:
In order to prepare ourselves for the automated deployment again, copy-paste this small script, name it terraformdeploy-pipeline.ps1 and just change the tfvars name. So the new file will look like this (I’ve stripped the comments here):
terraform init
terraform plan -out="out.plan" -var-file="service-varvalues-pipeline.tfvars"
terraform apply "out.plan"
Notice also how we got https for free -we didn’t install any certificate or configured anything. Azure took care of it.
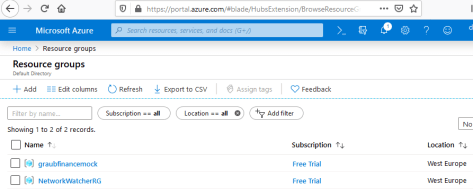
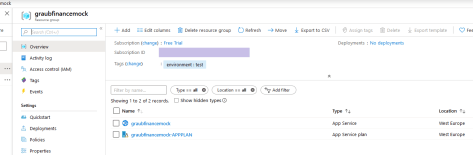
Out of curiosity, let’s head over to portal.azure.com to see what happened. Once there, click on “resource groups” and then “graubfinancemock” (or whatever you named it). You’ll see something like this:
Did it cost much? Click “Cost analysis” on the left, for scope select your subscription (by default named “Free trial”) and you see what you paid for our experiment:
It didn’t break the bank, did it? 🙂
To be fair, we didn’t really do much. Most of the CPU usage we were charged for went into getting the system -our linux container running wiremock- up and running. Just out of curiosity, how much does it cost if we use it a little more?
You can try the following experiment: have it answer 1000 (or whatever) requests and see what it costs. Try this powershell script:
cd $env:TEMP
mkdir testrequests
cd testrequests
for ($i=1;$i -le 1000;$i++) { Invoke-WebRequest -Uri "http://graubfinancemock.azurewebsites.net/servicehealth" -OutFile "out-$i.txt"; $i }
After it finishes, click refresh and let’s see the cost analysis again:
No joke: after 1000 requests, it didn’t change a cent. You can see why companies love the cloud! Though again, we didn’t use our CPU heavily -and that’s what Azure charges mostly for.
We’re close to finishing. The last thing to do is to automate the process via Azure Devops (a.k.a. VSTS, a.k.a. TFS Online). Just one last thing: since we’ll be doing the terraform deploy automatically, let’s delete everything we’ve done. Create a file named cleanup.ps1 inside our devops dir and paste the following:
param ([string]$rgName)

[bool]$rgExists = ((az group exists -n $rgName) -eq 'true')

if ($rgExists)
{
        az group delete -n $rgName -y
}
else
{
        Write-Host "Resource group $rgName does not exist, nothing to do"
}
Now in the command prompt, run:
./cleanup.ps1 -rgName graubfinancemock
A couple of minutes later, everything’s gone.
[EDIT] Just to be clear, this means that every time we deploy, we first delete everything and then we redo it from scratch.
This is fine for our scenario, the mock service, and in general it’s ok when both of these conditions are true:
1. Our Azure components have no state to lose (no databases etc) and 2. The down time doesn’t hurt.
For more complex scenarios, where you have real productive services, state, data etc this approach is not possible. In such cases you need to keep somewhere your plan and state files. This, and the best practice to do so, is explained here by the Terraform team and here by Microsoft.
Let’s put the “Build once, Run anywhere” promise to the test: build the container for the mock service
Though there are many, many, many ways to run a service you’ve built in different environments, most of them require extensive reconfiguration, are problem prone and break easily. Just ask any developer that has built apps for IIS .
Docker is very popular because it solves this problem neatly. It builds a container -a box- within which your application lives. This stays the same everywhere, be it the dev PC, your local staging and production environment or the cloud. You still need, of course, to know how to communicate to other services or how the world reaches you, but this is reduced to a few configuration files.
And, while usually I’m suspicious against overhyped products and technologies, Docker really is easy to use.
How easy? Well, that’s what we need to do for our mock service:
The last step is to publish it so that it’s available for others (like our cloud instance which we’ll create next) to use. In the command window enter the following commands (use the login details you created in dockhub, step 1):
docker login
docker image tag graubfinancemock:1.0 YOURUSERNAME/graubfinancemock:1.0
docker image tag graubfinancemock:1.0 YOURUSERNAME/graubfinancemock:latest
docker image push YOURUSERNAME/graubfinancemock:1.0
docker image push YOURUSERNAME/graubfinancemock:latest
That’s it. Seriously, we’re done. But let’s take a moment and explain what we did.
First of all, the dockerfile. It contains all the info for your container and, in our case, states the following:
“FROM rodolpheche/wiremock“: don’t begin from an empty environment; instead, use the image named “wiremock” from account “rodolpheche“, who has already created and published a suitable docker configuration (thanks!)
The two “ADD” lines tell it to add (duh) files into the filesystem of the container
The “CMD” tells the container what to do when it starts. In our case, it runs the java package of wiremock, passing a few command line options, like –global-response-templating
Now the docker commands.
The “docker image build” builds the image, i.e. creates the docker file system and stores the configuration. It gives it a name (graubfinancemock) and a version (1.0). A version is just a string; it could also be, say, 1.0-alpha, 2.1-RC2, 4.2.1 and so on.
The “docker container run”, obviously, runs the image. The important thing here is the “–publish 80:8080”. By default, the wiremock server listens to port 8080. So here we instruct docker to map port 80 (visible from the world) to port 8080 (inside the docker container). That’s why we can use the url http://localhost/servicehealth and not http://localhost:8080/servicehealth .
The last this is to publish the image. You need to login, obviously, and then you have to tag the image. You can assign as many tags as you want, so you can e.g. publish to many repositories. The format is REPOSITORY/IMAGE:VERSION. In docker hub the repo name is your username, but it can be different in private repositories. After tagging, you push the tag, which uploads the image.
Note that apart from the normal version (graubfinancemock:1.0) we also tag the image as latest (graubfinancemock:latest). This way when using the image we won’t need to update the version every time we upload a new one; we’ll just say “get the latest”.
But be careful here: if you build a service -forget our mock for a minute, let’s say we’re building an actual service- and people are using your image as :latest, they might unwillingly jump to an incompatible version with breaking changes (say, from 1.x to 2.0). So it’s a much safer strategy to tag your images as :1.0-latest, :2.0-latest etc instead of just :latest. This way, consumers are fairly certain that they only get non-breaking changes.
Private repositories are out of scope for this post, but in an enterprise setting you’ll probably need them; you usually don’t want the whole world to be able to use your container images. Creating a private repo is not hard, but it’s not free anymore. The easiest ways to do that is in Dockerhub itself or in Azure, where it’s called a container registry. Using it, though, is exactly the same as a public one. If it’s not on docker hub, you just have to prefix the tag with the repo address (see “Now the new feature!” in this post).